Filmmaker
Dashboard
Understand your audience, measure emotional resonance, and discover what moments from your film's journey people love most.
12.8k
Total Viewers
87
Hype Score
4m 32s
Avg. Time
Audience Engagement
Unique Viewers
Returning Viewers
Avg. Session Duration
Bounce Rate
Top Performing Sections
Which pages get the most engagement
Scroll Depth Heatmap
How far visitors scroll down the page
43% of visitors scroll to the bottom of your page
Completion Rate for Key Interactions
Percentage of visitors who completed each action
67%
Played the teaser
52%
Read the creator's note
71%
Saw full cast list
85%
Viewed BTS rows
43%
Reached footer CTA
Emotional Signals
Reaction Breakdown
Emotional resonance from your audience
Poll Results
What your audience thinks
Which character resonates most?
Preferred color palette?
Most anticipated scene?
Moodstrip Interactions
Which vibe board images attract attention
Audience Breakdown
Traffic Sources
Where viewers come from
Device Distribution
How viewers access your hub
62%
Mobile
31%
Desktop
7%
Tablet
Geographical Clusters
Regions with high engagement
“You're big in Brooklyn!”
Content Performance
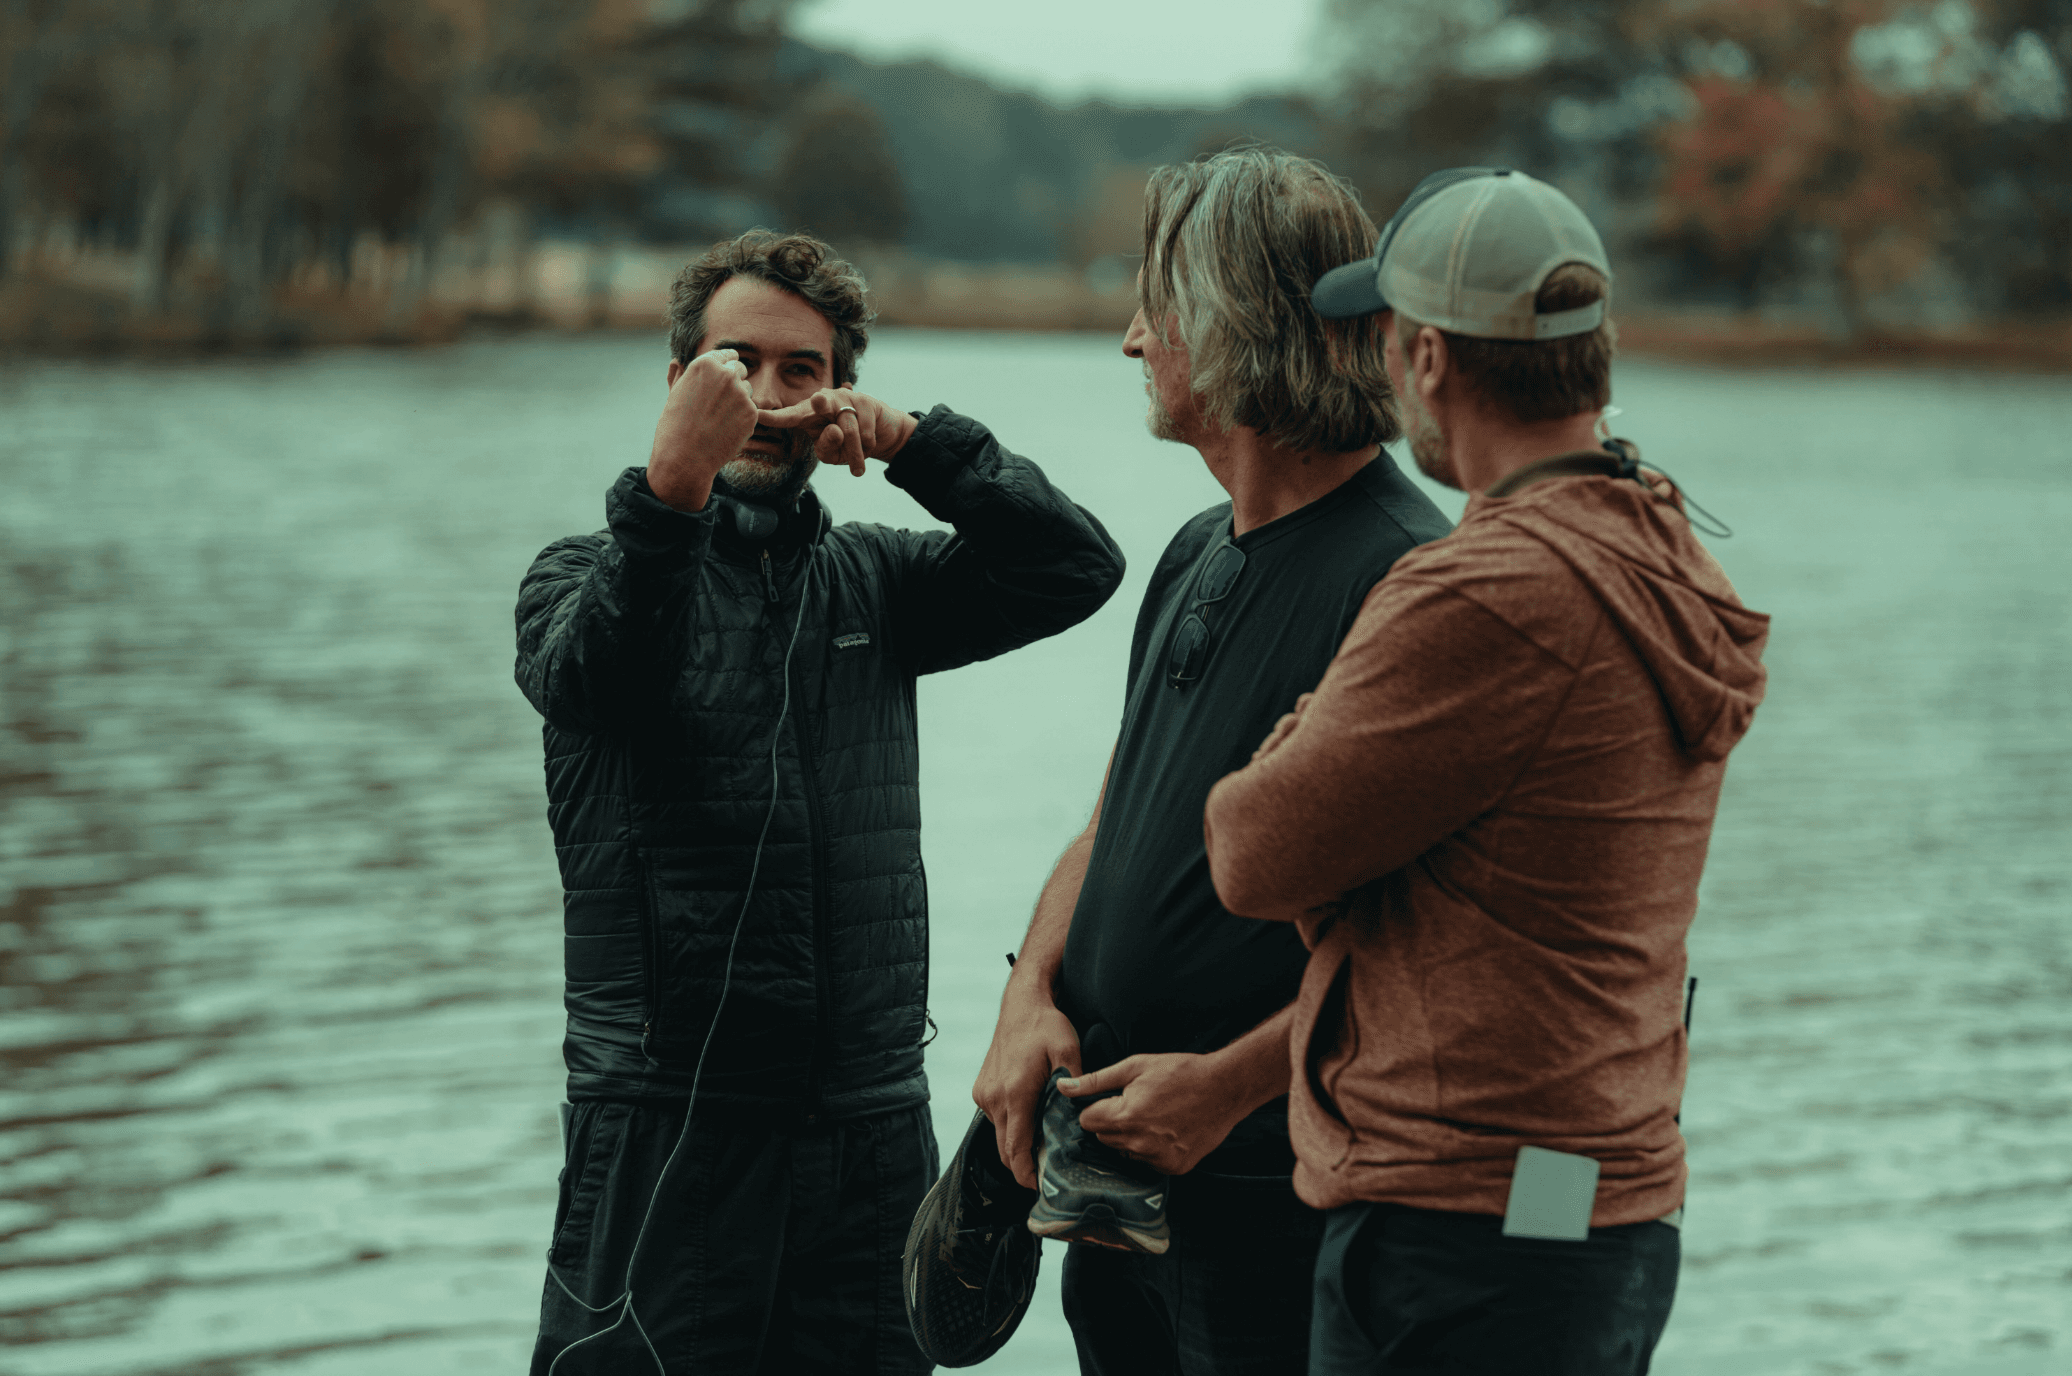
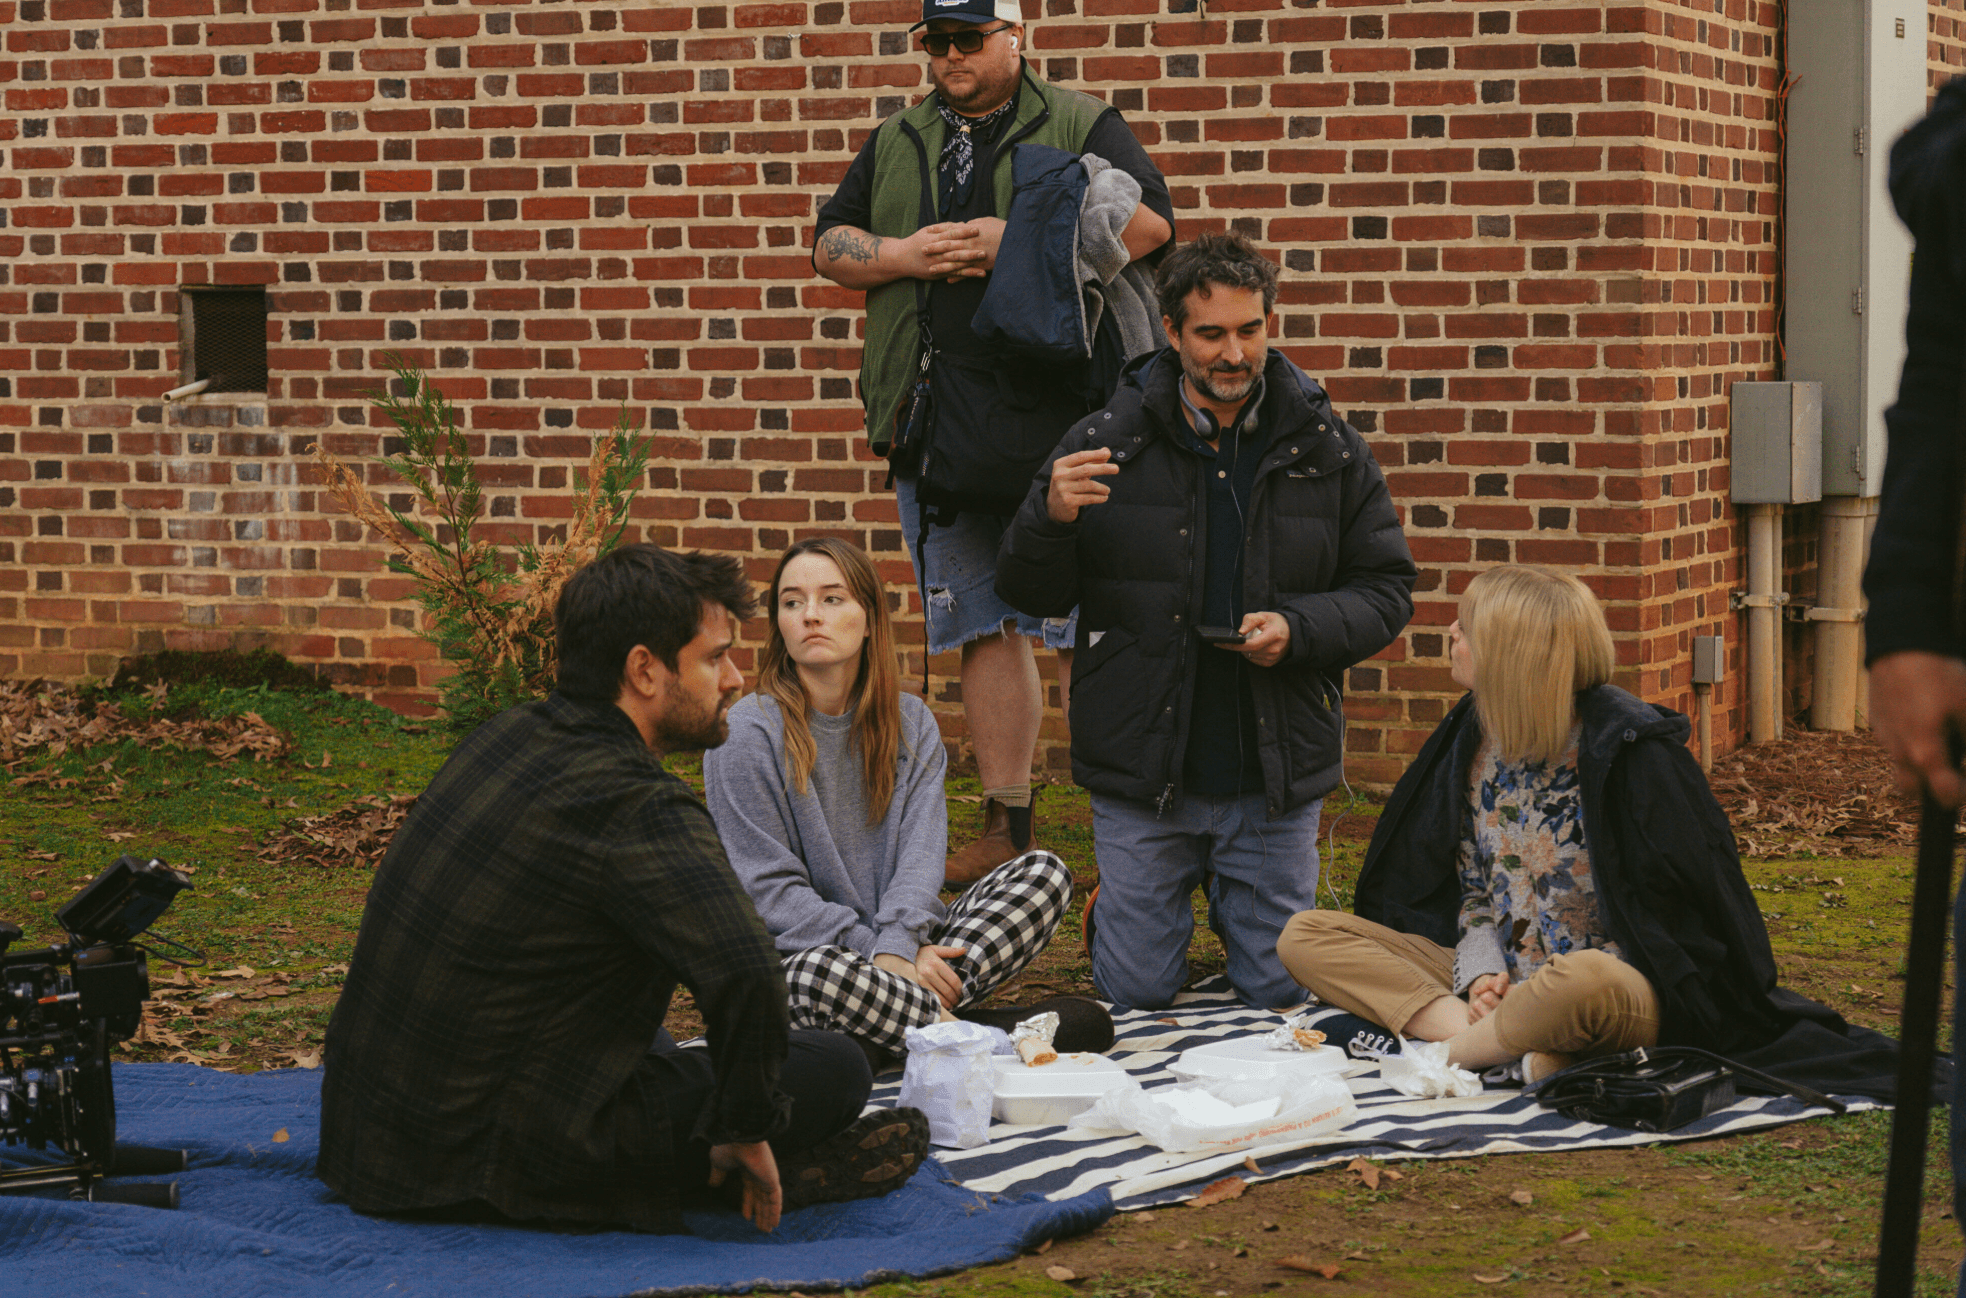
Top BTS Photos
Ranked by interaction
Director's Vision
2,341 interactions
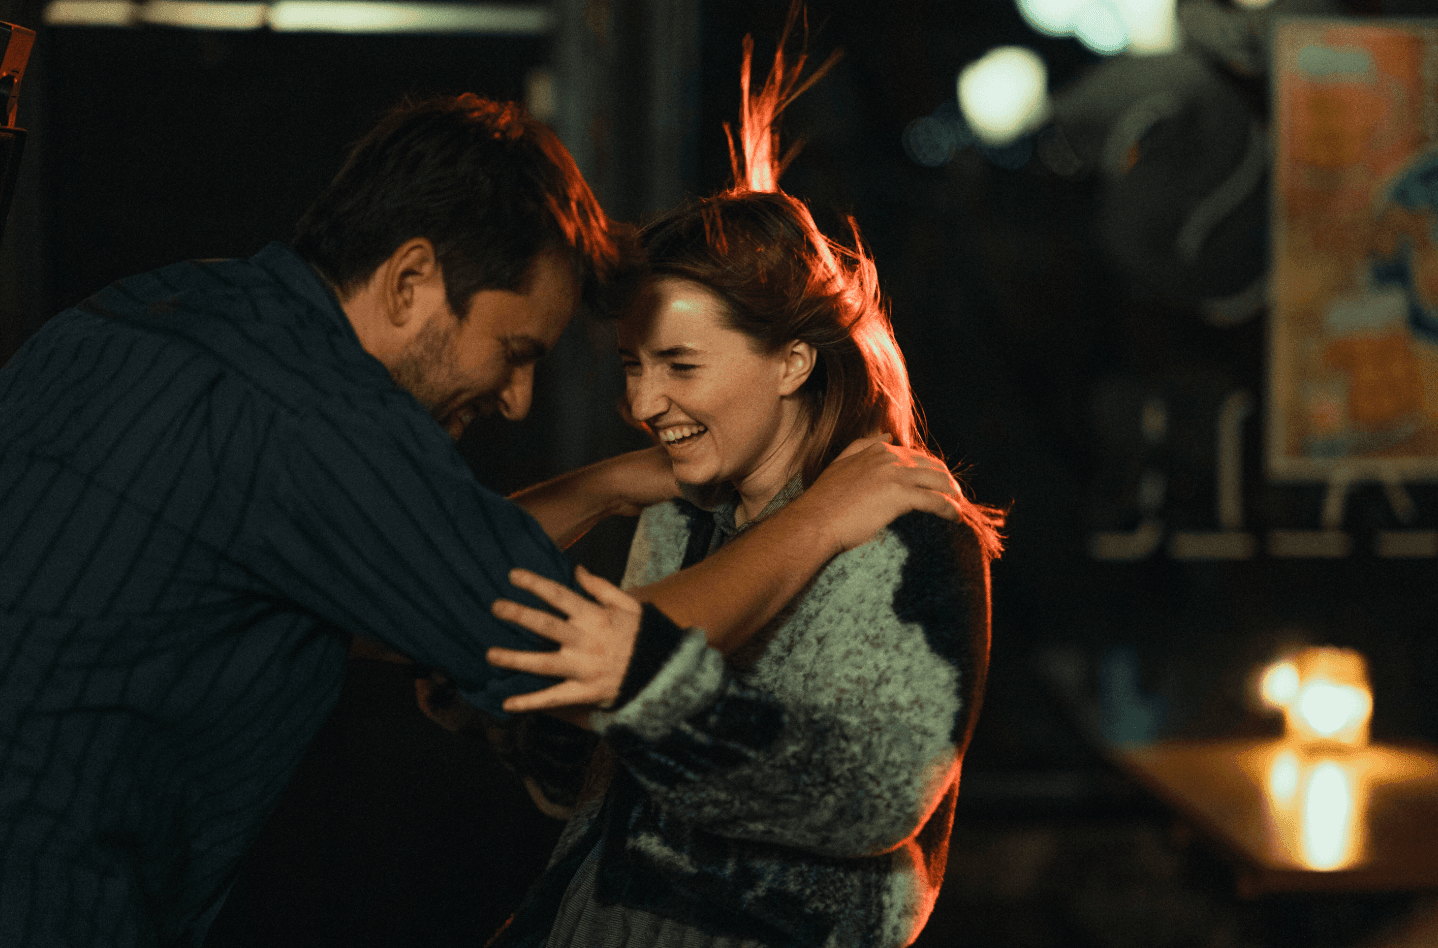
Cast Chemistry
1,892 interactions
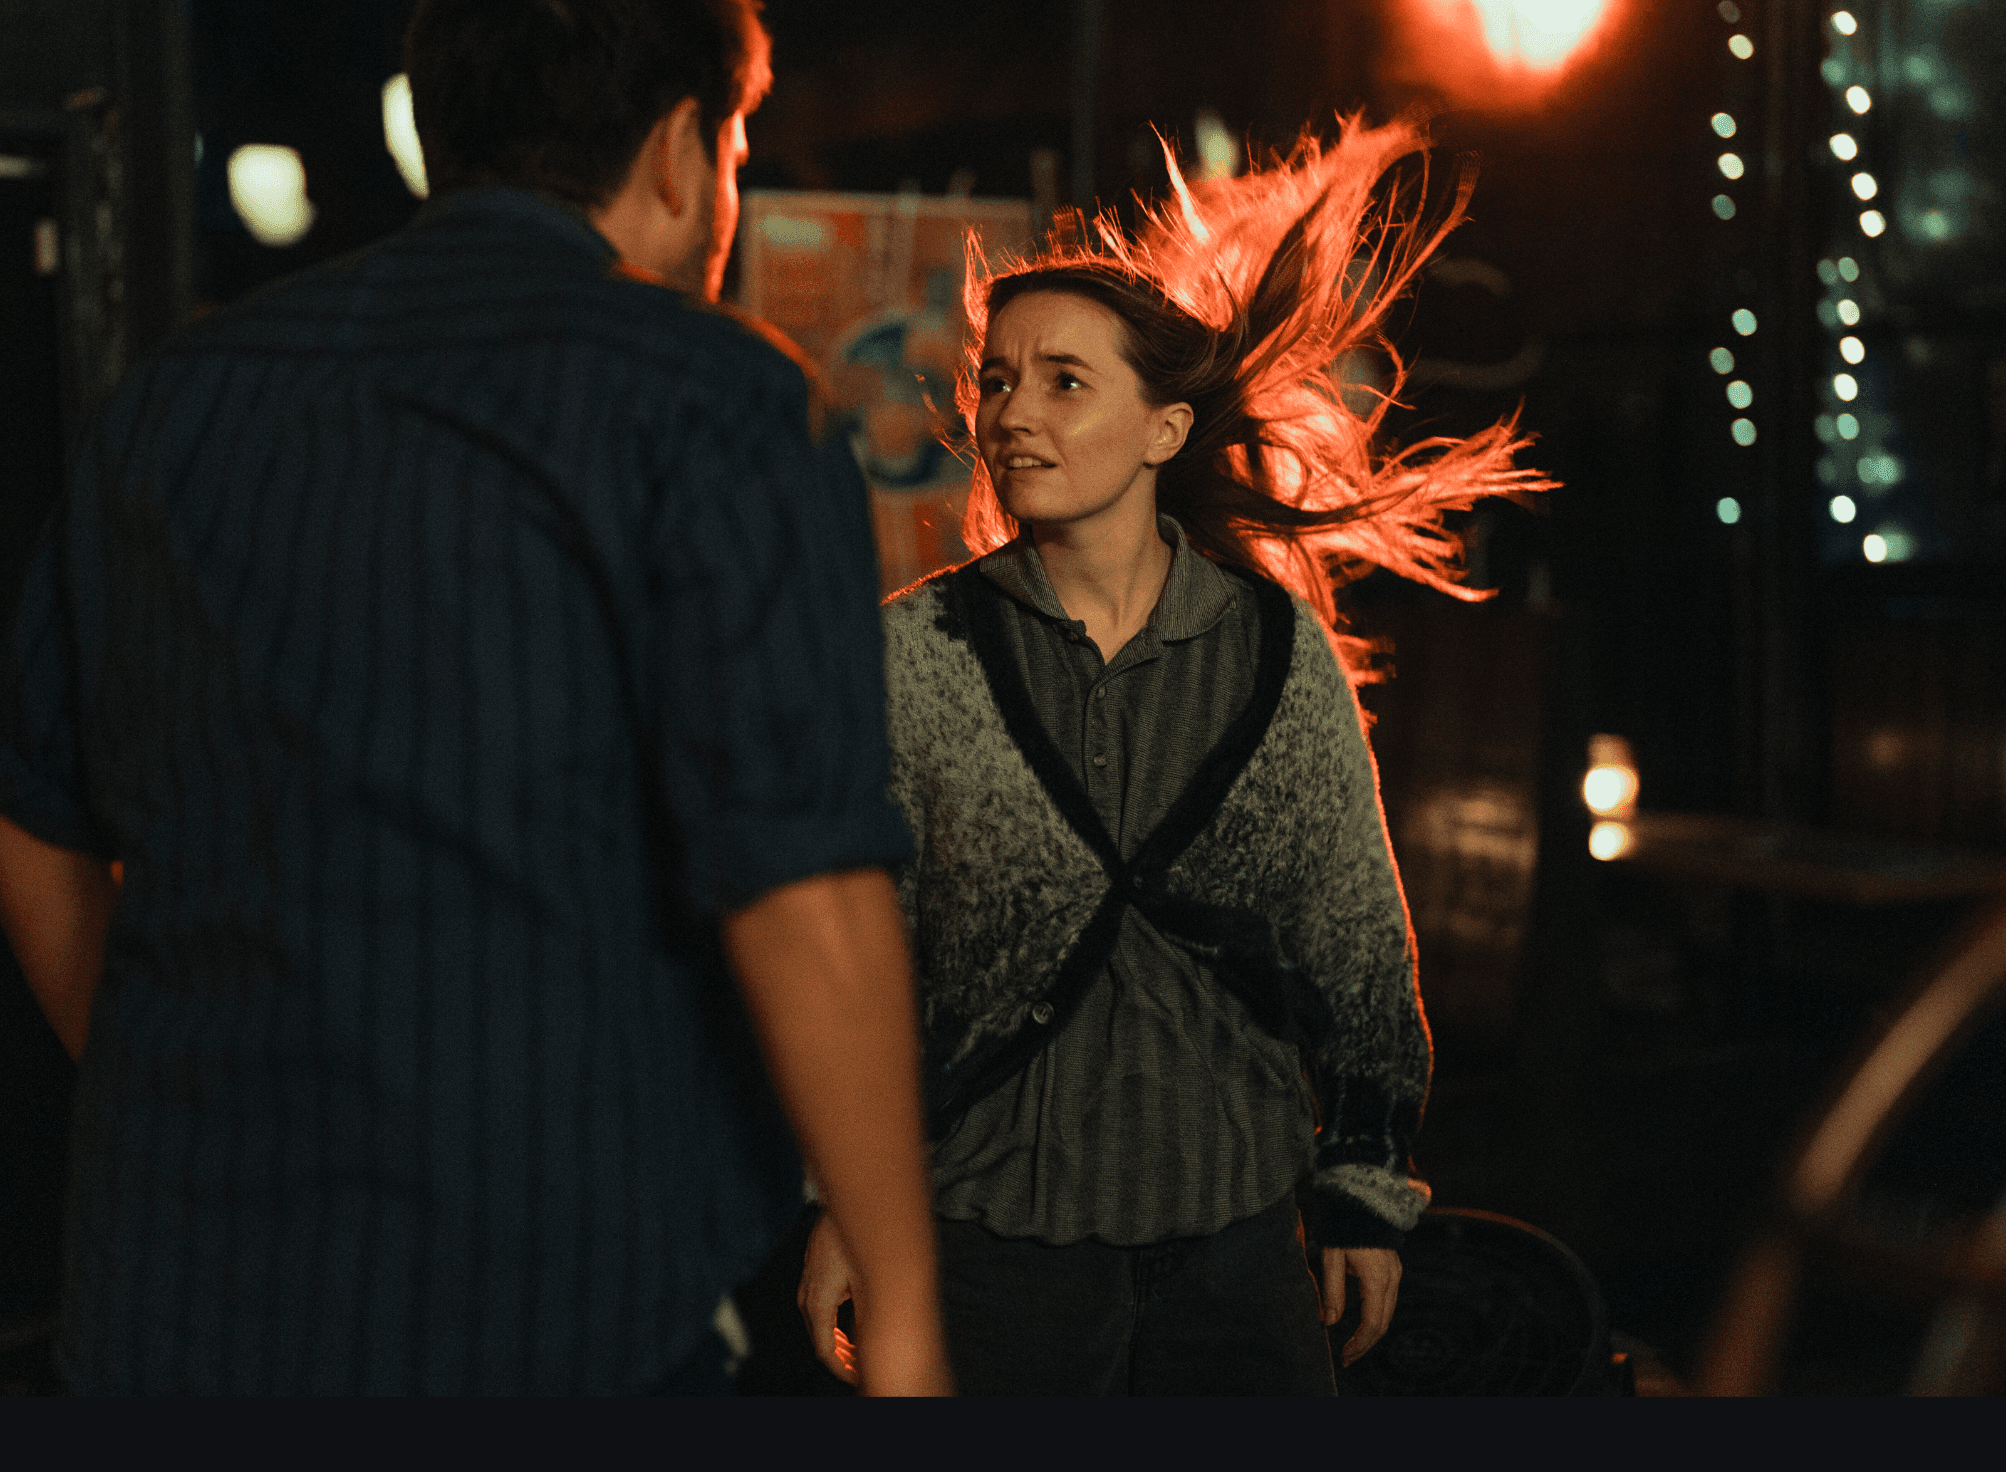
Night Sequences
1,654 interactions
Most Liked Diary Entries
Production updates people love
Cast Member Spotlight
Which bios get clicked most

Kaitlyn Dever
3,421 clicks

David Duchovny
2,847 clicks

Jay Duplass
2,103 clicks
Useful for PR planning
Trailer Analytics
67%
Play Rate
42%
Finish Rate
1m 23s
Avg Watch Time
8,621
Total Plays
Viewer Retention
Where people drop off
This data helps you cut stronger trailers
Email Capture
2,847
Total Subscribers
22%
Conversion Rate
Top Converting Section
Creator's Note section
50% of subscribers came from here
Subscriber Sources
What content moves people to follow
Festival Readiness
Hype Score
87
Based on engagement, return visits, and emotional reactions. Use this to pitch festivals and distributors.
Promo Asset Downloads
Press interest signals
142
Press Kit
523
Poster Kit
312
Trailer Kit
47
Questions
Support Metrics
12%
Click-through Rate
234
Total Backers
Average Contribution
$47
Top Referrer
Cast & Crew section
Support Conversion Funnel
What drives financial support
Weekly Insights
This Week's Highlights
BTS from Day 03 is trending
+70%Your behind-the-scenes content from Day 03 received 70% more engagement this week.
Kaitlyn Dever's bio is hot
70% increaseHer profile page had a 70% engagement increase this week. Consider featuring her more.
Viewers return after Creator's Note
Most returning viewers last read the Creator's Note before coming back.
Post a new diary entry
HighEngagement is rising. Consider posting another diary entry on Thursday for maximum impact.
Moodstrip performing well
MediumYour moodstrip receives above-average reactions compared to similar films on Helix.
This is where Helix feels magical.
Recommendation Engine
When enabled, Helix will use advanced embeddings to provide personalized insights:
“Users who liked this BTS also liked...”
“Your audience responds most to intimate, warm stills.”